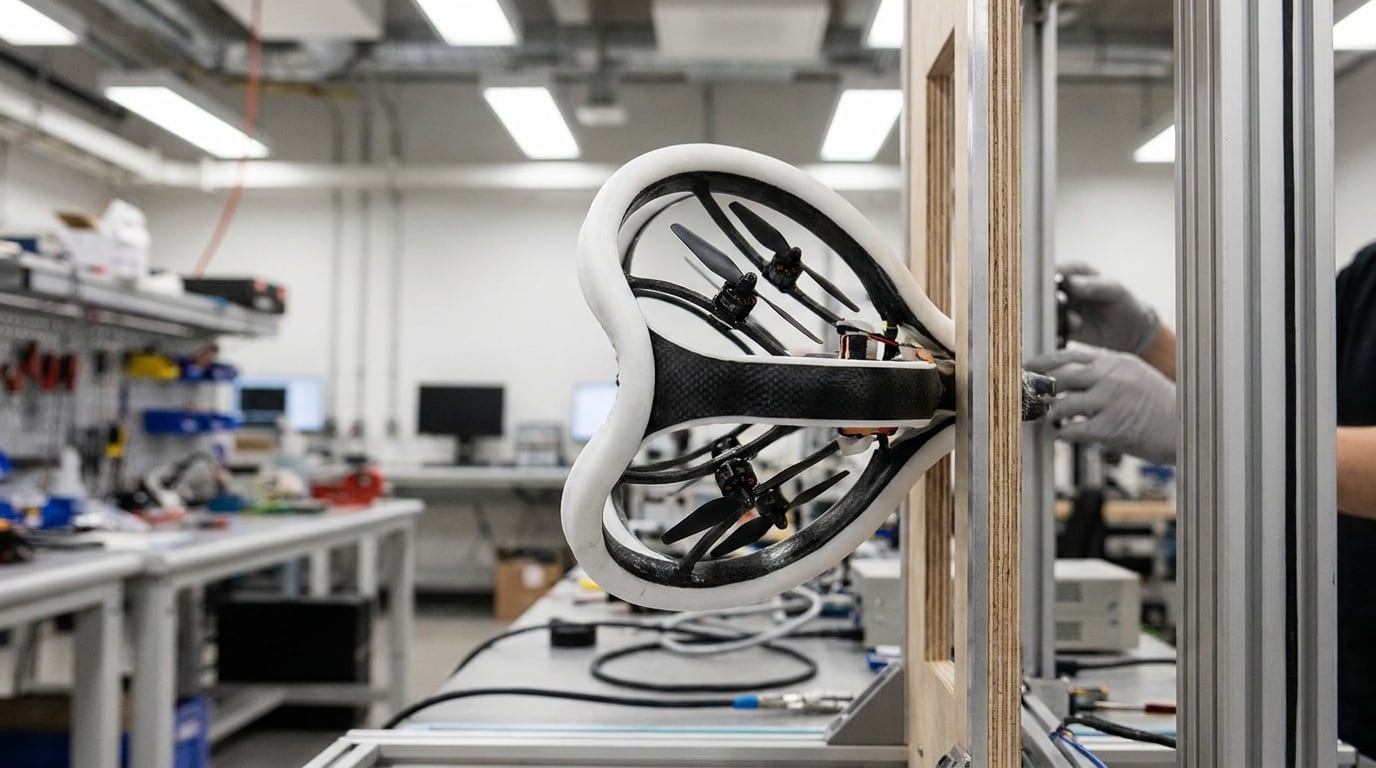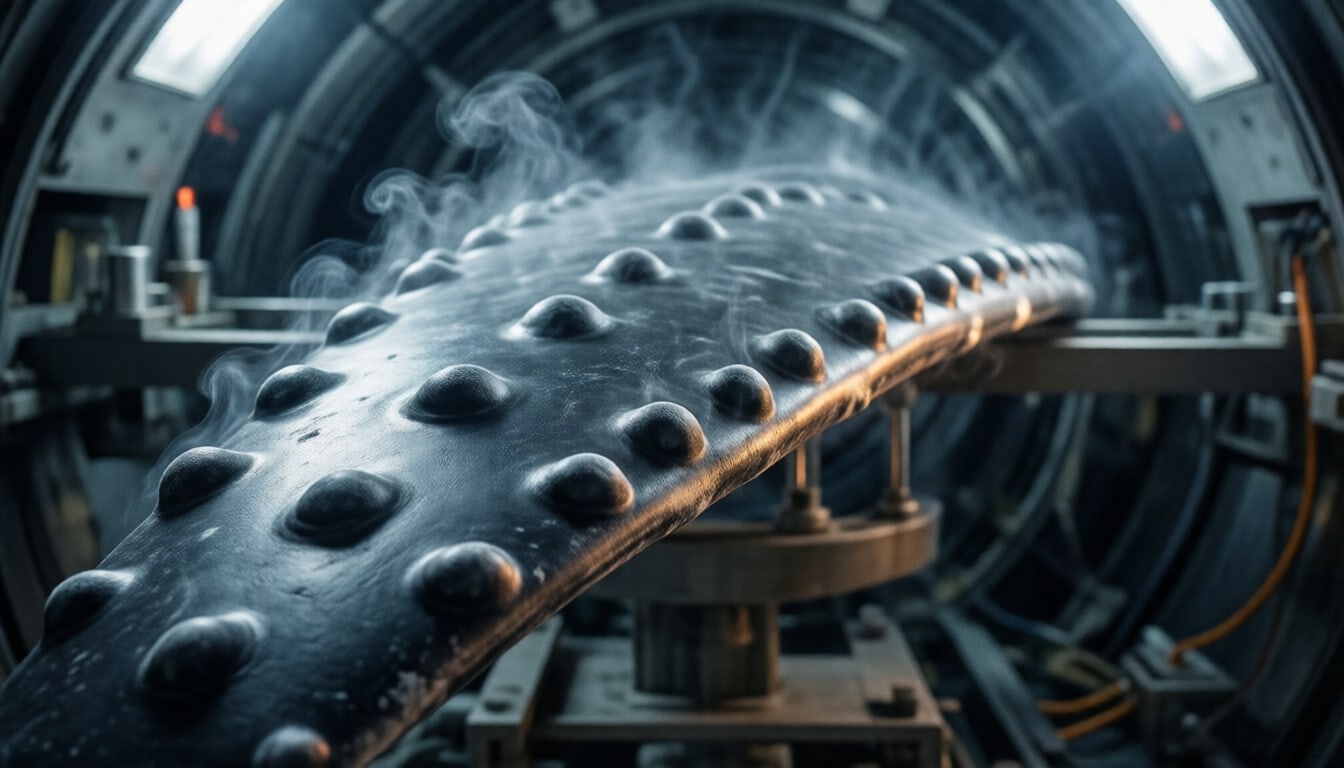
The humpback whale weighs up to around 30 tonnes, yet it turns tightly enough to trap shoals of fish in nets of bubbles. Part of the explanation sits on the leading edge of its long pectoral flippers: a row of rounded bumps called tubercles. For more than two decades engineers have asked whether the same bumps can make wind-turbine blades and fans work better. The wind-tunnel evidence is real. The widely quoted figure of "20 % more energy" for wind turbines is not independently documented. This article separates the two.
1. Why a whale flipper interests aerodynamicists
A wing or blade produces lift by turning the air that flows over it. Increase the angle of attack and lift rises — until the flow can no longer follow the suction side. It separates, lift collapses and drag jumps. That is stall. Wind-turbine blades, fans and aircraft wings are all designed around it, and the abruptness of stall matters as much as the angle at which it begins.
Humpbacks turn with their flippers at high angles of attack, where a smooth wing of similar shape would be expected to stall. The tubercles were the obvious suspect.
2. The biological mechanism
Frank Fish and colleagues, who have studied the flipper since the 1990s, summarised the mechanism in a 2011 review in Integrative and Comparative Biology. The tubercles generate pairs of counter-rotating streamwise vortices in the troughs between them. These vortices carry momentum from the outer flow into the boundary layer, which keeps the flow attached for longer behind the tubercle peaks.
The result is compartmentalised stall: instead of separating over the whole span at once, the flow separates section by section. The review compares the effect with the vortex generators and strakes used on aircraft. Note what the 2004 experiment did not show: it included no flow visualisation, so in that paper the vortex mechanism was a hypothesis supported by force measurements, later backed by simulations and other experiments cited in the review.
3. Aerodynamic principles
Two numbers decide whether a wind-tunnel result transfers to a turbine:
- Angle of attack — tubercles change the shape of the lift curve mainly around and after stall. Below stall, the 2004 data show no gain and, close to stall, a small penalty.
- Reynolds number — the ratio of inertial to viscous forces, . The flipper model was tested at about . The blades of a modern multi-megawatt turbine operate at Reynolds numbers in the millions (our assessment, not taken from the studies), where boundary layers behave differently.
4. Experimental evidence
The founding experiment is Miklosovic, Murray, Howle and Fish, Physics of Fluids 16(5), L39–L42 (2004). They tested a half-model of a flipper with a NACA 0020 section, with and without tubercles, in a wind tunnel at –.
| Study | Type | Setup | Main result | Caveat |
|---|---|---|---|---|
| Miklosovic et al. 2004 | Lab, peer reviewed | Flipper half-model, NACA 0020 | Stall angle +40 % (16.3° vs ≈12°); C_Lmax +6 % (0.88 → 0.93); up to 32 % lower drag after stall | One model; less lift at 9.3–12°, more drag at 10.3–11.8° |
| Hansen, Kelso & Dally 2011 | Lab, peer reviewed | 2D aerofoils NACA 0021 and 65-021 | Benefit larger on NACA 65-021; small amplitude gives higher C_Lmax and later stall | Abstract read; compares tubercle amplitudes |
| Energy Convers. Manag. 255 (2022) | Lab, peer reviewed | Wind-turbine aerofoil, Re 2.5–6.5 × 10⁵ | Lower stall angle, but smoother stall, no hysteresis, no laminar separation bubble | Abstract read |
| Ke et al. 2022, Energy 239 | Simulation (CFD), peer reviewed | NREL Phase VI rotor | Lower performance at ≤ 7 m/s; benefit grows at higher wind; with tubercles on > 60 % of span, backflow disappears at 10 m/s | Simulation only |
| Hasan 2025, Wind Energy | Lab | Small turbine, trailing-edge tubercles plus dimples | 14.98 W vs 13.72 W at 8.8 m/s | Watt scale, different design |
Two details from the 2004 paper are often lost. First, between 9.3° and 12° the tubercled model produced less lift than the smooth one, and between 10.3° and 11.8° it had more drag. Second, the numbers differ between sources: the paper's text says 16.3° and 6 %, a figure in the same paper suggests about 17.5°, and Duke University's press release spoke of nearly 8 % more lift.
5. WhalePower's experiments
WhalePower Corporation is a Canadian company in which inventor Stephen Dewar and biologist Frank Fish are principals; Philip Watts is co-inventor on the patents. In 2007–08 it fitted retrofit tubercle blades to a small Wenvor turbine at the Wind Energy Institute of Canada (WEICan) on Prince Edward Island.
What is documented:
- The 2011 review shows a measured power curve from the turbine test, with better performance "at moderate wind speeds", but gives no percentage.
- WhalePower's website states that the blades produced "20% more annualized power than the original Wenvor stock blade" and that "detailed results are confidential".
- The turbine's size is reported as 25 kW (Design Engineering), 30 kW with a 10 m rotor (WhalePower) and 35 kW variable-pitch (the 2011 review).
Measured power curve or calculated AEP? A power curve is measured: electrical output binned against wind speed. Annual energy production (AEP) is normally calculated by combining that curve with a wind-speed distribution for a site. The word "annualized" suggests the 20 % is such a calculation, which would make it sensitive to the assumed wind distribution and to how many data points were collected at each wind speed. This is our inference; the method, test duration and data coverage have not been published.
A worked example (hypothetical numbers). Suppose a blade raised output by 30 % between 9 and 13 m/s and changed nothing elsewhere. At a site where the wind spends a large share of the year in that band, the annual gain could approach the quoted figure; at a site dominated by 4–7 m/s winds it would be a few per cent — or negative, if the low-wind penalty seen in the CFD study applies. Without the binned power curve and the assumed wind distribution, a reader cannot tell which case the 20 % describes.
Is the 20 % independent? No. An analysis of the WEICan data by Laurens Howle of Duke University is frequently presented as validation, but Howle is a co-author of both the 2004 and 2011 papers with Frank Fish. The WEICan report itself is listed in the U.S. OSTI database but is not publicly readable. A 20 % figure from one test on one small turbine, with confidential data, cannot be presented as a general result for wind turbines.
6. Engineering challenges
- Scale. All published experiments ran at Reynolds numbers below about . Utility-scale blades operate far higher.
- Where the benefit lies. The documented gains are near and after stall. Modern pitch-regulated turbines are controlled to avoid stall over most of their operating range, which may limit the benefit (our assessment).
- Low-wind penalty. The CFD study of the NREL Phase VI rotor found lower performance at 7 m/s and below — the wind speeds where many turbines spend much of their time.
- Independent validation. We found no independent field test with a published power curve and no certification of a tubercle blade.
- Manufacturing and leading-edge erosion. A wavy leading edge must survive rain and particle erosion like any blade edge; we found no published data on this (our assessment).
7. Commercial applications
The commercial story so far is in fans, not turbines. The European Patent Office named Dewar, Watts and Fish finalists for the European Inventor Award in 2018 and wrote that tubercle fans can move up to 25 % more air; a licensee was reported to sell high-volume, low-speed (HVLS) fans in many countries. Those performance figures are manufacturer claims. The underlying patents include US 6,431,498 (Watts and Fish, granted 2002, now expired), US 8,535,008 (Dewar, Watts and Fish, assigned to Whale Power Corporation, granted 2013) and EP 1805412.
We found no evidence that tubercle blades are used on commercial utility-scale wind turbines today.
8. Future research
What would settle the turbine question is an independent field test with a published power curve measured to a recognised power-performance procedure, on a turbine with and without tubercles, plus wind-tunnel tests at Reynolds numbers closer to those of large blades. Noise and fatigue-load claims — "20 % quieter" fans and "6–8 % lower fatigue loads" have circulated — also need measurements; we found none.
For engineers who want to experiment, tubercle amplitude and wavelength are the main design parameters. Hansen and colleagues found that smaller amplitudes gave higher maximum lift and later stall on 2D aerofoils, while larger amplitudes performed better after stall. The review by Roy, Das and Biswas suggests that small amplitude and short wavelength work best at low wind speeds. On a real blade those trade-offs would have to be re-optimised along the span, because local Reynolds number and angle of attack change from root to tip.
9. Engineering verdict
Tubercles are a well-documented way to delay and soften stall at low Reynolds numbers. That is a genuine aerodynamic effect, shown in peer-reviewed wind-tunnel experiments. For wind turbines, the evidence is a prototype test whose data remain confidential, a peer-reviewed power curve from researchers with a stake in the company, and independent simulations that find both a penalty and a benefit depending on wind speed.
Explore the sustainability implications of whale-inspired blades on [Sustainability.dk](https://sustainability.dk/nyheder/pukkelhvalens-finner-udskyder-stall-men-gevinsten-for-vindmoeller-er-uafklaret) (in Danish, translated into 19 languages).
Technical fact box
- Technology: leading-edge tubercles (sinusoidal leading edge)
- Inspiration: pectoral flippers of the humpback whale (Megaptera novaeangliae)
- Key lab result: stall angle +40 % (16.3° vs ≈12°), C_Lmax +6 %, drag after stall up to −32 % (Re ≈ 5 × 10⁵)
- Penalty: less lift at 9.3–12°, more drag at 10.3–11.8° (same study)
- Turbine claim: 20 % more annualized power (WhalePower; data confidential)
- Turbine test: Wenvor turbine at WEICan, 2007–08; size reported as 25, 30 or 35 kW
- Simulation: lower performance at ≤ 7 m/s, benefit at higher wind (NREL Phase VI rotor)
- Commercial use: HVLS fans (manufacturer figures); none found on utility-scale turbines
Sources
- Leading-edge tubercles delay stall on humpback whale (Megaptera novaeangliae) flippers — Physics of Fluids 16(5), L39–L42
- The tubercles on humpback whales' flippers: application of bio-inspired technology — Integrative and Comparative Biology 51(1):203–213
- European Inventor Award 2018 finalists: Stephen Dewar, Philip Watts and Frank Fish — EPO
- WhalePower: Testing and third-party testing — WhalePower Corporation
- Influence of leading-edge tubercles on the aerodynamic performance of a horizontal-axis wind turbine: A numerical study — Energy 239 (Part B)
- Performance variations of leading-edge tubercles for distinct airfoil profiles — AIAA Journal 49(1):185–194
- Leading edge tubercle on wind turbine blade to mitigate problems of stall, hysteresis, and laminar separation bubble — Energy Conversion and Management 255
- A comprehensive review of the application of bio-inspired tubercles on the horizontal axis wind turbine blade — International Journal of Environmental Science and Technology 20(4):4695–4722
- Aerodynamic Performance Investigation of a Biomimetic-Based Small-Scale Horizontal-Axis Wind Turbine: An Experimental Analysis — Wind Energy
- US 6,431,498 B1 — Scalloped wing leading edge — USPTO
- US 8,535,008 B2 — Turbine and compressor employing tubercle leading edge rotor design — USPTO
- Whale-Inspired Wind Turbines — MIT Technology Review
Other news outlets are named as sources but not linked.
Discussion
Technical questions and corrections are welcome. Comments are signed and checked before they appear.
No comments yet.
Sign in to add a typed review comment. Reviews are signed with your name.